Report — Visualizing the Performance Characteristics of Computations (My Contributions to Dask).

Ten weeks passed by in a flash! poof!
During the Community Bonding Period, I had a great time attending the Dask Summit, which, to my surprise, coincided with my time at Dask. I learned a lot about Dask through the presentations and workshops. Aside from the summit, I had weekly meetings with my mentors to discuss the development of my project, setting up my laptop with the dask environment, and brainstorming ideas. The complexity of Dask’s codebase, its organization, and the process of having a PR merged astounded me. Then came the coding phase. This was the period during which I learned the most. Working towards merging PRs, discussing improvements, and troubleshooting were critical learning experiences for me.
I discovered how a minor modification may have a large influence on several parts of the code. One of the most rewarding experiences was correcting mistakes and making improvements as I progressed. As a novice developer, I was introduced to a plethora of new methods, practices to adopt and to avoid.
A Layman’s Guide to My Field of Work
there is a software called dask. dask does a lot of stuff, but I am only concerned about one thing - task graphs. enter task graphs. task graphs are cool. they provide a great intuitive sense of their programs. oh wait, lemme also talk about dask collections. examples of dask collections: dask arrays, dask dataframes, etc. they are like numpy arrays and pandas dataframes. task graphs show the high-level (and low-level too) representation of the python code dealing with these dask collections. it shows a flowchart of the computation flow. they have two forms — graphical (using graphviz) and html (using… html). grahviz is a library that renders beautiful graphs. it’s very simple to work with. i worked on making it look cooler and more informative. and that’s it. the end. may the _repr_html_ be with you :)

The Project
In my official application, under the section “Why I want to get selected”, I mentioned this:
… reasons I have been active in Dask is the immensely constructive community, and I will keep myself updated with other developments. The community was very helpful in getting me started with the development tasks.
… I find this project super fun to work with. This project is inspiring to me because it will give me exposure to Dask’s codebase, learn new topics every day and increase my understanding of the inner workings of Python and, specifically, how great visualization can be so crucial.
and it turned out to be so true. I’m happy with my job at Dask and what I can bring to the table. I’m overjoyed that I picked Dask as the organization where I’ll be spending my summer. I had high expectations, and they were all graciously met.
My project focuses on improving the visualization of the Graphical and the HTML Representations of Dask computations. I worked on making them more illustrative, engaging, and informative.
It’s surreal that the code I developed is being utilized by thousands of people. It warms my heart to think that someone out there, who is entirely uninformed of the GSoC program, may look at the feature I introduced and exclaim, “Ayy, this makes my life simpler!”. This motivates me even further to give my best.
My Contributions
Throughout my project, I contributed to several Dask repositories hosted on GitHub (https://github.com/dask/). 8 project-related merged PRs.
dask/dask
- * Added product (alias of prod) (#7517)
- Fixing calling
.visualize()withfilename=None(#7740) - Add node size scaling to the Graphviz output for the high level graphs (#7869)
- Change graphviz font family to sans (#7931)
- Add
dask.arraySVG to the HTML Repr (#7886) - Add tooltips to graphviz (#7973)
- Add colors to represent high level layer types (#7974)
dask/distributed
- * Edited the path to
scheduler.py(#4983) - Add HTML Repr for
SecurityClass (#5178) - Add HTML Repr for
ProcessInterfaceClass and all its subclasses (#5181)
dask/dask-blog
- Google Summer of Code 2021 Project (#107)
dask/dask-tutorial
- * Updated Binder Badge Image (#211)
* signifies that the PR is not related to the project.
Every PR I have worked on is special to me and has its own story. It’s magical to see the PR icon turn green to purple 💜.
- I started my GSoC project by fixing a bug caused while calling
visualize()withfilename=None(Issue #7685). This proved to be the perfect introduction to the Graphviz code base. I fixed it by adding an extra check condition before the line of error (PR #7740). This was also the first PR that introduced me to code testing. One thing that struck me was the fact that now anyone in the world could simply callvisualize(filename=None)and the code would work as intended. I fixed that. The code I wrote had a positive impact.

My mentors at Dask were excellent at advising me on a better route to take, suggesting fixes and helping me understand where I’ve gone wrong. I am happy I made all these mistakes early on, so I learned not to repeat them in future PRs.

- When the coding period started, my first task was to create a detailed report on the various visualization libraries that could be used in place of Graphviz to represent task graphs (Issue #7301). The report was made using a public editable Google Docs. I was very pleased to see the enthusiasm showed by the community who worked with me on the document. The report can be found here.

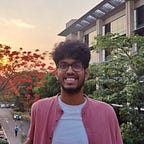
- I worked on adding dynamic node sizes to the High-Level Graphs on the basis of the number of tasks it contained (PR #7869). This was one of the tasks laid out by my mentor to add more characteristics to the representations of Task Graphs (Issue #7847). HLGs are a good way for any user to understand the entire computation from a larger perspective. With this new feature, users will have a better understanding of which layers are heavier than the rest.
Bigger Node := More Tasks Contained.

While working on this PR, I learned a valuable thing — the importance of discussion of ideas in such a nuanced code base. It’s refreshing to listen to the entire community’s opinion on the tiniest of the features. Everyone chimes in and the result is a well informed decision. It’s easy to go wrong at places, but when everything is open-sourced, it’s very easy to find mistakes and correct them before they get merged into the main codebase.
- I worked on adding the Dask Arrays’ structural images at every stage of the computation (PR #7886). Now, this was big! This was the other task laid out by my mentor to add more characteristics to the representations of Task Graphs (Issue #7847). This is my favorite PR as I learned the most from this. I found it a little challenging to implement this, but this is where I realized the importance of pre-existing code. My life became much easier by using already-implemented functions to get my work done. I also experimented with various demonstrations and also tested the performance (speed) as this was a quite noticeable visual change. Users would no longer need to examine the state of their Dask Arrays after each step. I show it to them in a very clean intuitive way. Yay! I love my work here.

- I worked on adding tooltips to the High-Level Graph’s graphical visualization (PR #7973). This PR might be the most useful to the users as it bridged the gap between the Graphical and the HTML representations of a Task Graph (Issue #7970). I added crucial information about each layer on the node as a tooltip. So, users can now simply hover over the layer, and yayyy, they now know a lot about the layer from the graph itself.

- I worked on coloring the High-Level Graph’s layers’ (PR #7974). This PR introduces an optional alternative to the standard black-and-white graphviz graphs. At the same time, it also helped categorize the high-level layers (Issue #7919). I color each layer by its
layer_type. This would illustrate the potential bottlenecks of the computation and allows the user to learn more about the program’s performance characteristics. It also looks very colorful and I love colors! So, getting this PR merged made me the happiest!

- I worked on adding the HTML Representation for the Security Class (PR #5178) and the ProcessInterface Class and all its subclasses (PR #5181). After finishing the Graphviz side of the code, I moved on to the HTML side and added some lovely representations of a few classes. Users would no longer see a simple text line, but rather a convenient HTML table or a header.


I also worked on some quick PRs.
- I worked on changing the font family of the Graphviz to a cleaner family — Sans (PR #7931). In this PR, I changed the font face from Times-Roman to Helvetica. This makes the graphical representation consistent with the Jupyter HTML output. In addition, after adding node scaling, large nodes tend to look a bit dull with serif fonts. Sans fonts (Helvetica) make the larger nodes easier on the eyes and they seem like headings rather than paragraph text.

- I worked on adding
pandas.DataFrame.productmethod to Dask (PR #7517). This was part of the ongoing effort to import more methods from Pandas DataFrames to Dask DataFrames (Issue #1259). This was my first-ever PR and it introduced me to the Dask code base. - I worked on updating an outdated piece of documentation (PR #4983). It was just a 1-line change, but this was a very special PR to me as this made me appreciate just how complicated everything was. I was just going through the code base, opening random files, following method call stacks, and my eyes pondered over this tiny little path that had been changed since. I opened a PR and it got fixed. Voila! This PR also served as a great introduction to the Dask Distributed code base.
- I worked on adding documentation about the new features I had merged on a Dask Blog (PR #107).
Genevieve and Martin have always been fantastic at advising me on a better course of action, suggesting solutions, and assisting me in understanding where I go wrong. They have inspired me to become a lifelong contributor to open source. I’ve improved as a developer and open source contributor, and I now understand how open-source organizations work. GSoC provided me with an incredible opportunity to explore all of this during my undergraduate years.
P.S. I like markers🐧a lot.